

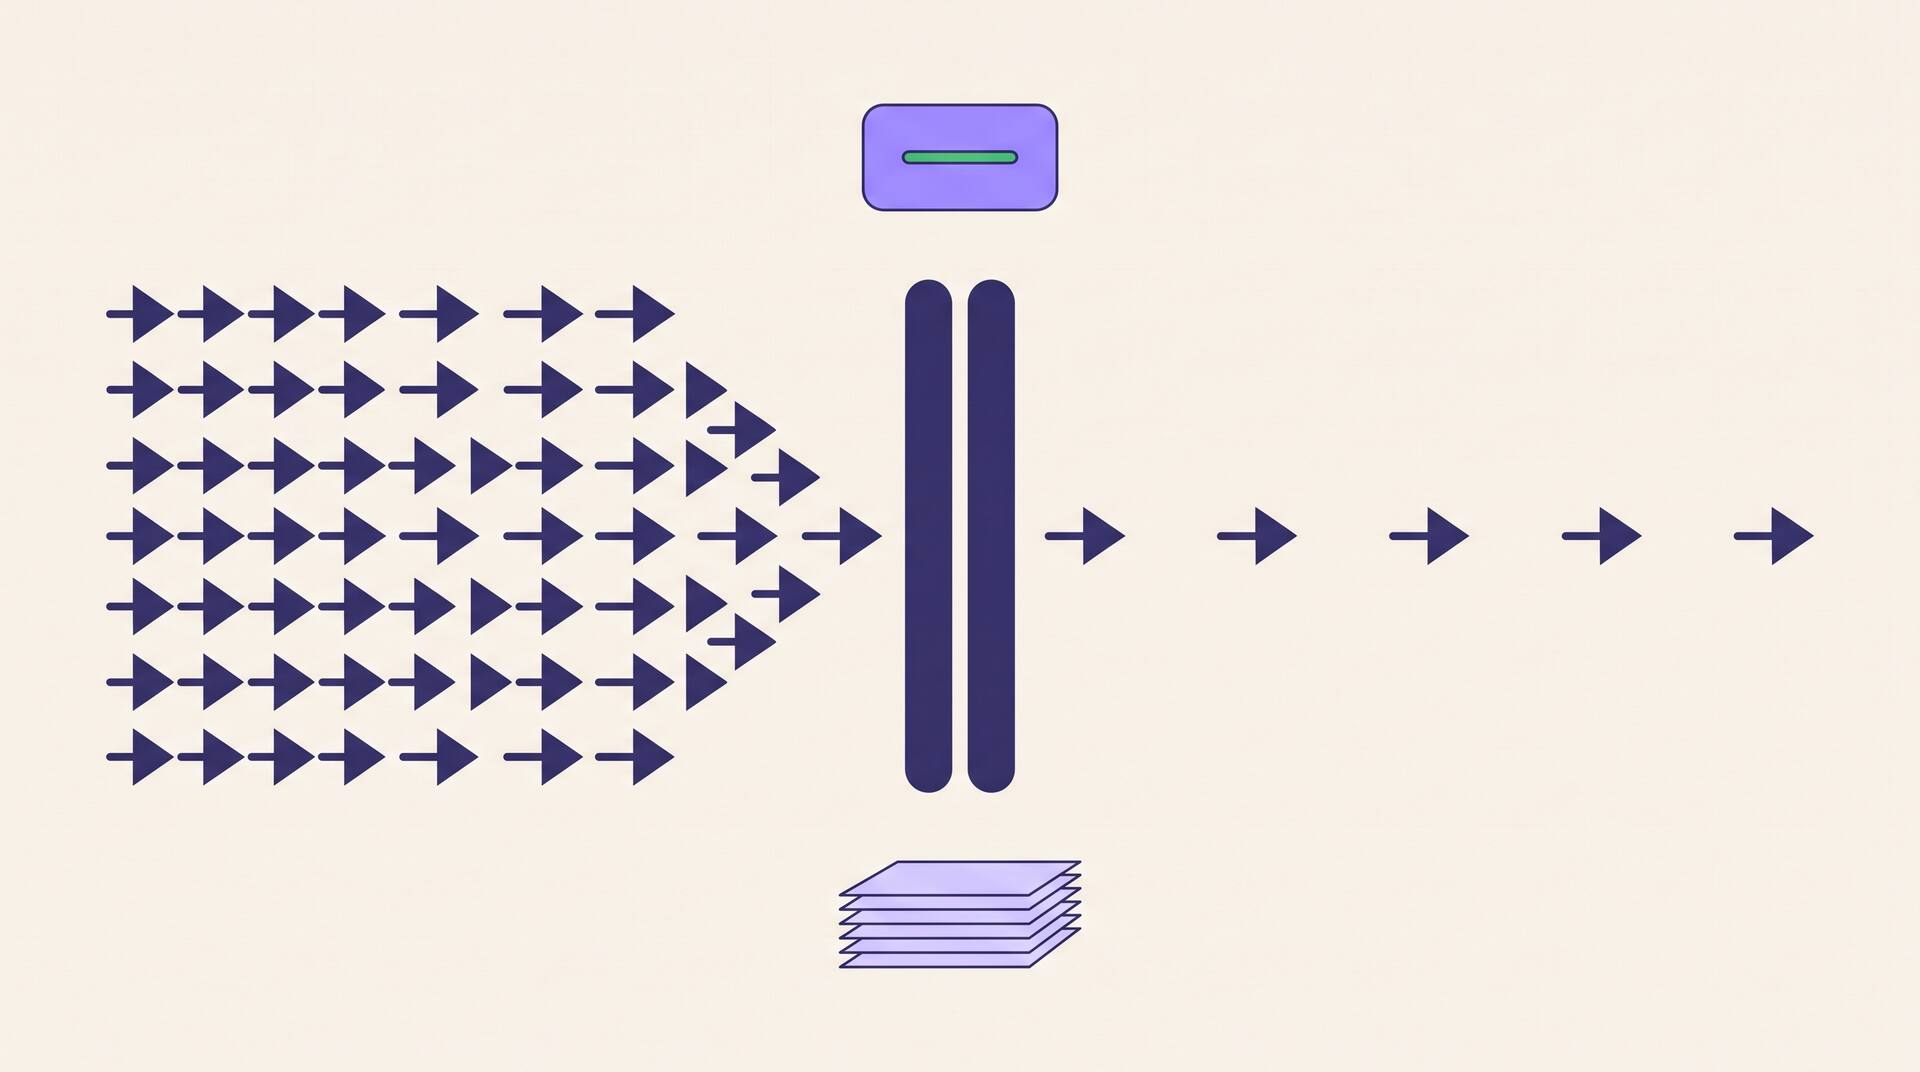
I run the engineering on an AI book writing platform. We have had days where a listing, a launch or a campaign puts more people through the product in an hour than a normal week does, and the pattern is consistent enough to be worth writing down. The things that broke were never the things I had a graph for. They were the things where I had no way to ask.
Here is roughly the order it goes in.
Minute one
The front door is fine and it tells you nothing
Every marketing page we serve is statically prerendered at build time and handed out by a CDN. Blog, pricing, comparison pages, the lot. Under a spike they do not care. Response times do not move.
This is worth saying because it is the first thing you look at, it looks great, and it is irrelevant. Nobody has reached anything that costs money yet. The load that matters is the thin set of authenticated paths behind the signup: create a book, generate an outline, generate a chapter, export a file. On a spike day, a static site health check is a comfort object.
The health check is the same trap one level down. Ours runs every thirty seconds, and what it proves is that the process is accepting connections and that it loaded its functions at boot. It cannot fail because of anything a user is experiencing. A saturated machine passes its health check with total confidence, right up to the point where it stops passing anything, and the platform will keep routing traffic to it because that is what you asked the check to decide.
Minute ten
How many, but not where
The free metrics we get from our host are HTTP response counts grouped by status code. Under a burst that number moves and you learn that some fraction of requests are failing.
What it does not have is a per endpoint breakdown. Our backend is one router process in front of roughly eighty separate functions, so a spike of 500s is a single undifferentiated number covering chapter generation, cover generation, checkout, webhooks and email sends alike. Knowing that four hundred requests failed somewhere is very close to knowing nothing, because the response to "checkout is failing" and the response to "cover generation is failing" are not the same response and one of them can wait until tomorrow.
Meanwhile the live log tail on the host holds a few minutes at most. If you look ten minutes late, you look at nothing. Everything I can actually reconstruct after the fact comes from logs we ship off the machines into a searchable store, and from an id we stamp on every request. Without those two, the honest answer to "what broke at 14:40" is a shrug.
Minute twenty
The queue you forgot you had
This is my favourite failure because it is completely silent.
Our PDF export runs as a serverless function that drives a headless Chromium. Rendering a whole book is memory hungry, so we allow exactly one render at a time per instance. A second export waits behind the first, and the function has a five minute ceiling.
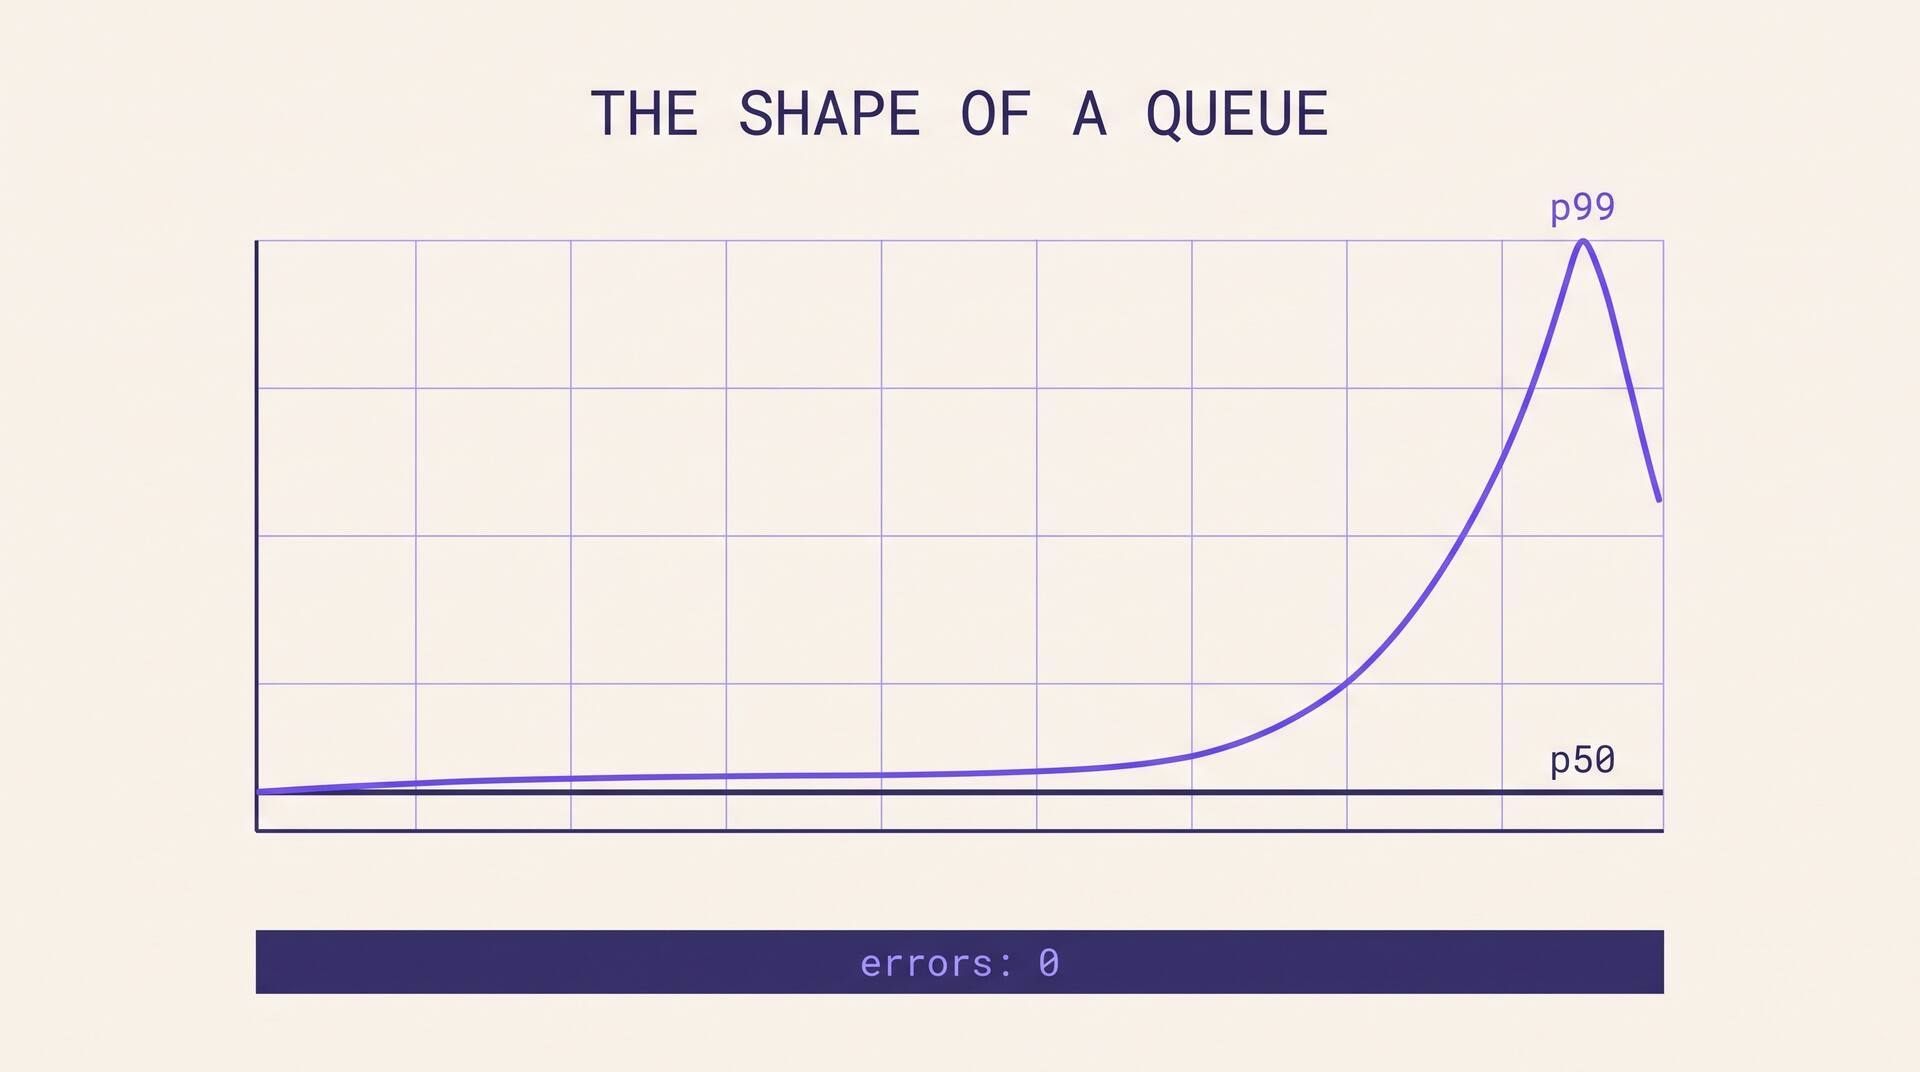
Under normal traffic you never see this. Under a burst, three people export a three hundred page book in the same minute, and the third one sits in a queue for most of their time budget before their render even starts. From the server's point of view nothing is wrong. No errors, no elevated status codes, the metric that I was watching stayed perfectly flat. From the user's point of view the export button does nothing for four minutes and then fails.
Saturation does not show up in status codes. It shows up in duration, and only if you are looking at the tail rather than the average. A p50 that has not moved while the p99 has quadrupled is the exact shape of a queue, and if the only number on your screen is a count of errors you will conclude the product is healthy while people are giving up on it.
The related lesson from the same subsystem: the renderer used to die on books full of full resolution chapter images, and the error it produced was a generic browser protocol failure, not anything mentioning memory. We fixed it by rewriting every image URL in the export HTML through our storage layer's image transform, capped at 1600 pixels wide at 80 percent quality. Real cause, unrelated symptom. Under load, the misleading symptom arrives first and in volume.
Minute forty
Your own retries are lying to you
There used to be an automatic fallback in our client. If a call to the primary backend failed, the browser quietly retried it against a second deployment of the same functions on a different provider.
It sounds prudent and it makes your numbers unreadable. Every failure becomes two requests. Every incident appears twice, in two systems, with different log formats and different timestamps, and if the cause of the failure was load then the retry is another unit of load arriving at the worst possible moment. A retry policy is a traffic multiplier that only activates when you are already in trouble.
We removed it. Now, when a call comes back with a status we consider real, the client reports the function name, the status and the request id to a small alerting endpoint that is deliberately hosted on the other provider, so an outage of the primary path does not also take out the thing that is supposed to tell me about it. That last detail is the only part of this design I would call properly thought through, and it came from an outage where the alarm went down with the system.
Pick the instrument on a calm day
There is a moment on a spike day where you consider signing up for something new, mid incident, and instrumenting the running system. Do not do that. You will get a blank dashboard, a config file you do not understand, and twenty minutes gone.
The time to compare observability tools is a quiet Tuesday, when you can be honest about how much you will actually maintain, because the choice you make under load is whichever one you can sign up for in four minutes. For a team our size the useful shape turned out to be three separate things and no more: request logs with an id, exception capture with stack traces, and product analytics for what people did. Traces are the obvious fourth and we do not have them, because I have not been able to justify the wiring cost against a request path that is usually two hops deep.
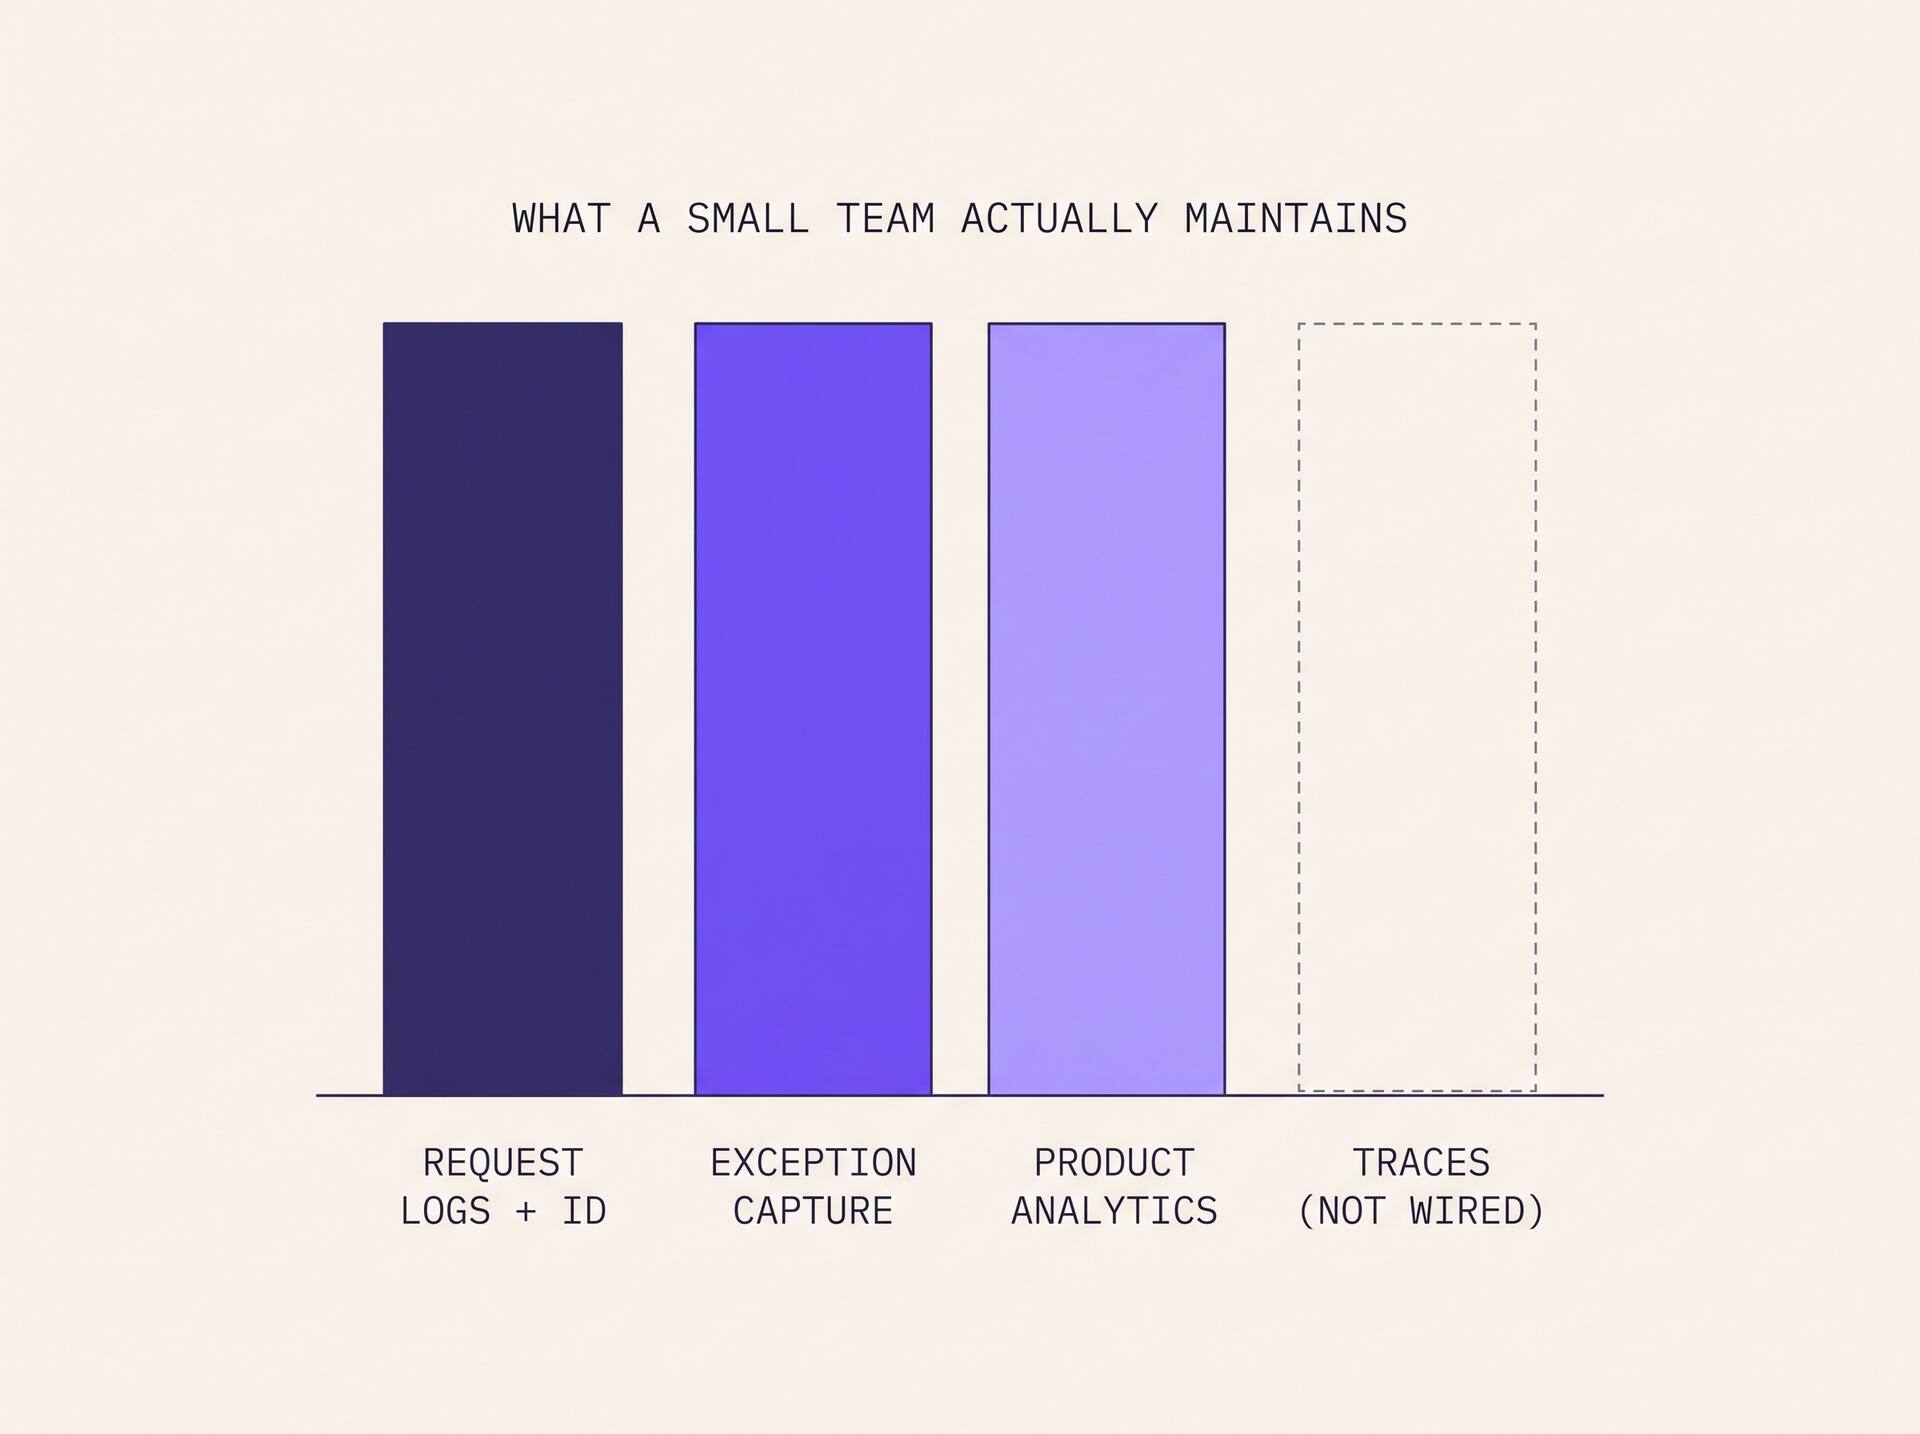
One thing I got right by accident is keeping the number of places I have to look small. During a spike you have minutes and a jumpy attention span, and every extra console is a tab you open, authenticate to and then misread. Two well populated tools beat five half configured ones, and a tool that is only ninety percent instrumented is worse than none, because you will believe the silence.
What I would push anyone to do, whatever they pick, is to write the queries before the day they need them. Not dashboards. Queries, saved in a file, in the repo, runnable in one command. The failure mode of dashboards is that you build the one that answers last month's question.
The number nobody has a graph for
Late in the day, when the systems are all green, the real question turns up: of everyone who arrived in that hour, what fraction reached a finished chapter?
No system metric answers that. Status codes cannot see it, because a user who signed up, opened the editor, got confused by the outline step and closed the tab produced nothing but 200s. Sentry cannot see it, because nothing threw. The only way to answer it is to have decided in advance that "finished a chapter" is an event worth recording, and to have recorded it with the same care you give to errors.
That is the measurement gap I would fix first, and it is not an infrastructure problem at all. Success in a product is a business event that you have to name yourself. Failure gets logged for free, by everything, forever, and that asymmetry quietly trains you to spend your spike days looking at the wrong screen.
What I would have ready before the next one
Four things, and none of them require a bigger budget.
A saved query per user visible step, so "which step is failing" takes one command rather than improvisation. An alert on duration at the tail, not just on error counts, because queues are silent. A written note of where every retry in the system lives, since retries are the difference between a small incident and a self inflicted one. And one named success event you can count in real time.
We do not load test. That is a real gap and I am not going to pretend otherwise. What we have instead is the ability to reconstruct any single request after the fact, from an id, in one query, which is a much weaker guarantee than knowing our limits in advance. It happens to be the guarantee that has actually got me through every spike so far.