

The important part is that no single process is alive for those forty minutes. Nothing in our system holds a lock, a job row, or a connection from beginning to end. The user's browser tab is the orchestrator. It makes one call, waits, gets a result, and makes the next one.
That design is good for reliability. It is terrible for knowing what happened.
A long job is not one long request
Each chapter is a streaming request into a function on our Fly backend. The client sets two timeouts on it: six minutes for the whole stream, and thirty seconds between chunks. If the model goes quiet for half a minute, we abort and tell the user rather than leaving a spinner running.
Both of those numbers exist because of things that went wrong, not because we sat down and derived them. A model provider that stalls mid response does not close the connection. It just stops sending, and without a chunk timeout the tab sits there looking busy forever.
So a forty minute book is maybe twenty to thirty separate HTTP requests, spread across three different runtimes, with a human clicking between them. There is no object anywhere in the system whose state is "this book generated successfully". That object would have to be invented, and until you invent it, every question about a long job is really a question about your logs.
The status code on a streamed response is a lie
This is the specific bug class I would warn anyone about first, because it cost me the most time.
Our router logs one line per request, after the handler returns. The line looks like this:
POST /functions/v1/book-chapter-generate fn=book-chapter-generate status=200 84ms request_id=...
For a normal endpoint that is exactly right. For a streaming endpoint it is nonsense. The handler returns a Response object as soon as the headers are ready, which is before the model has produced a single word. The status is 200 because the stream opened, and the eighty four milliseconds measures how long it took to open. The chapter that dies eight thousand tokens later is recorded as a fast success.
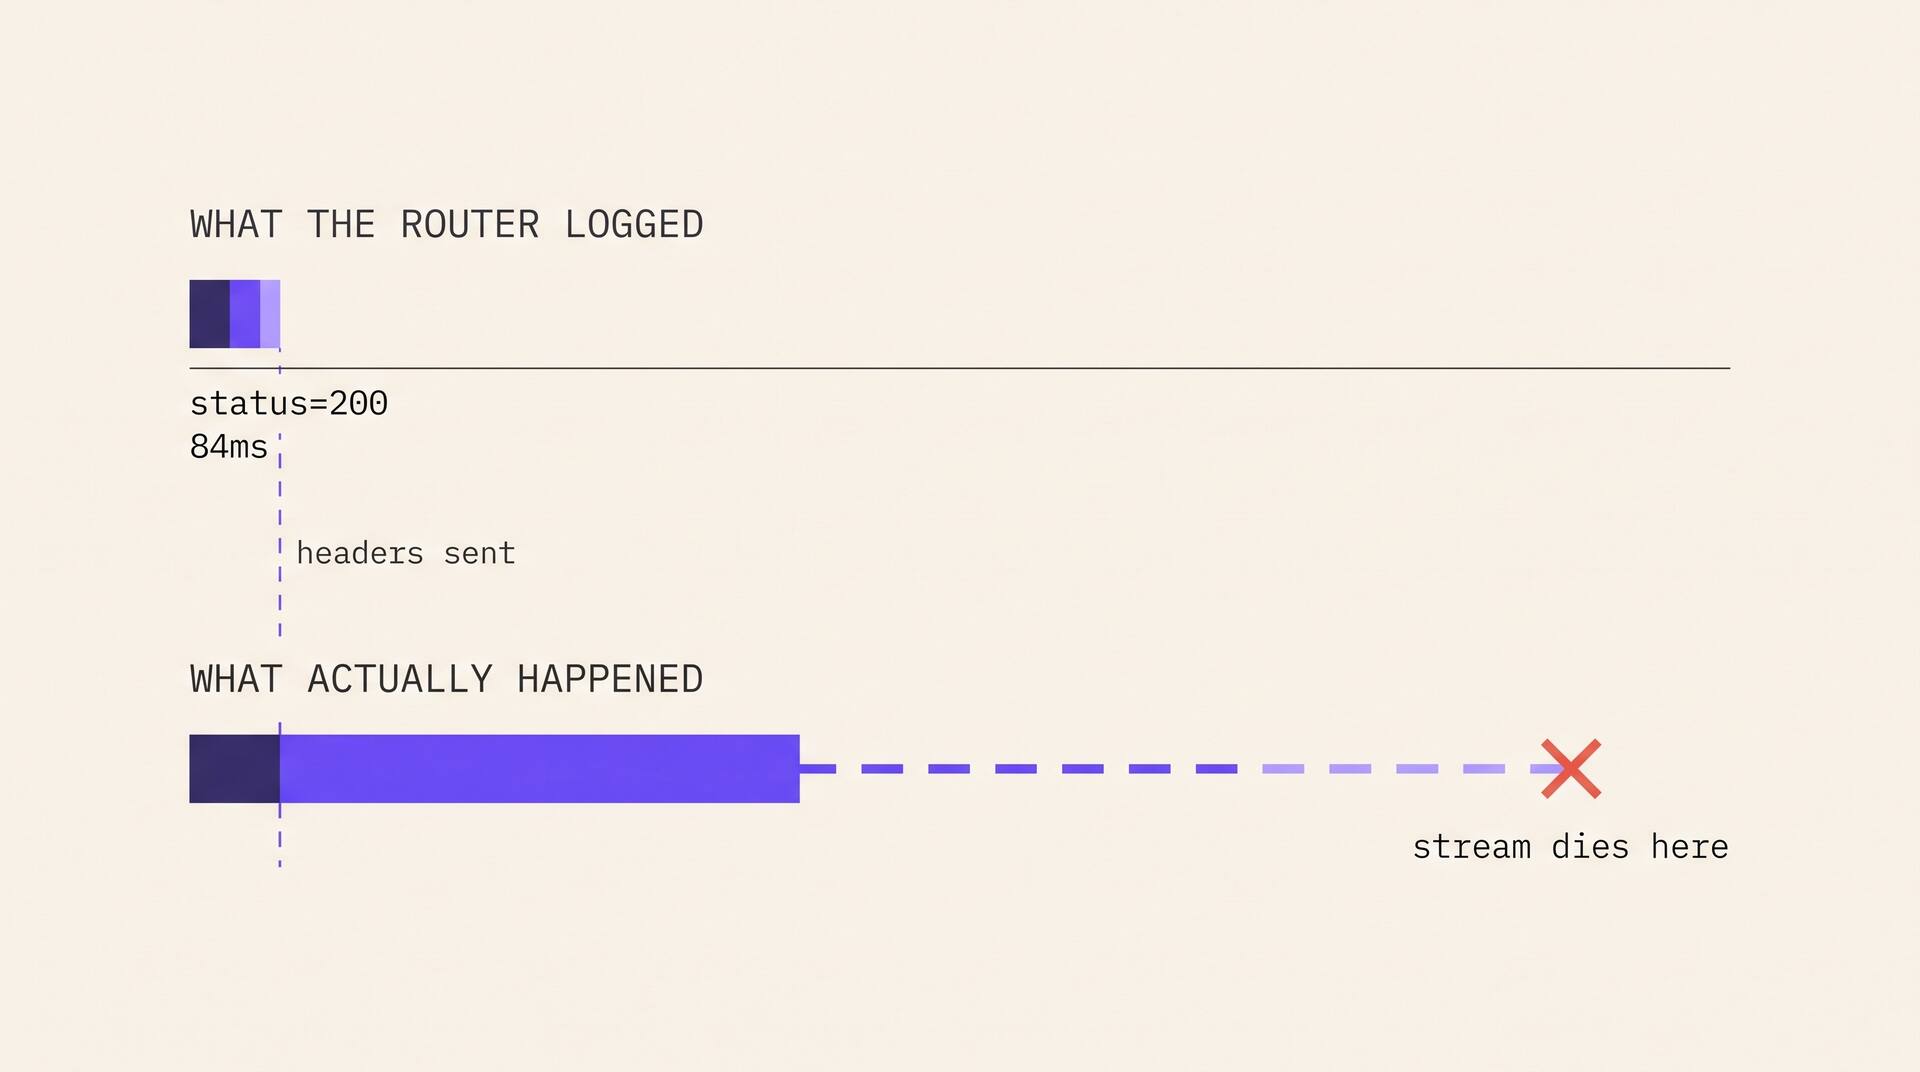
So we had a dashboard with a clean error rate and users telling us that generation stopped halfway. Both were accurate.
The fix is not clever. Log the end of the stream as its own event, with the same request id, carrying whether it completed, how many bytes went out, and how long it really took. Until you do that, a streaming endpoint is invisible to every counter you own.
There is a second half to this that is easy to miss. We deduct credits at the very end of a generation, deliberately, so a failed chapter costs the user nothing. That is the right billing behaviour and it also means the absence of a charge is the only durable trace that a chapter failed. Billing correctness quietly removed our best accidental signal.
Then nobody reads them anyway
Now the harder problem. Long jobs fail slowly and quietly, and the person who notices is the user, hours later, in a support message that says "it got stuck on chapter nine". By then, on a normal cloud setup, the evidence is gone.
Two things make it gone. The live log tail on Fly is a buffer of a few minutes, so anything you did not happen to be watching has already scrolled past. And the metrics you get for free, in our case status code counts from Fly's Prometheus endpoint, have no per endpoint breakdown at all. They can tell me that some 500s happened. They cannot tell me which of our seventy nine backend functions produced them.
That is the whole argument for shipping logs somewhere else, and the practical question is only which of the log monitoring tools you point them at, because the requirement is boring: the logs have to outlive the machine that wrote them, and you have to be able to search them by an id rather than scroll them. We ship everything from the backend, router lines and every function's console output and crashes and out of memory kills, into a single dataset with thirty day retention, and query it from a shell script. It is not a sophisticated setup. It is just off the box, in one place, searchable.
There is one line in there that I would happily trade several dashboards for, and it is written once at startup. Our router imports every backend function when the process boots and then logs how many of them it managed to load, naming any that failed. A function with a bad import does not crash the server. It just is not there, and every request to it comes back as a service error while the other seventy eight work perfectly. Without that boot line, the symptom is one broken feature and no reason.
A larger team would route the same signal into an itsm platform so a failed run becomes a ticket with an owner and a clock on it. At our size it is a message and me, which works right up until it does not.
The id is the part that turns this from a pile of text into an answer.
One id, or none of this works
Every request that hits our backend gets a request id, and we set it back on the response in an x-request-id header. Functions inherit it through async local storage, so any log call inside a function is stamped with the same id without the function author doing anything.
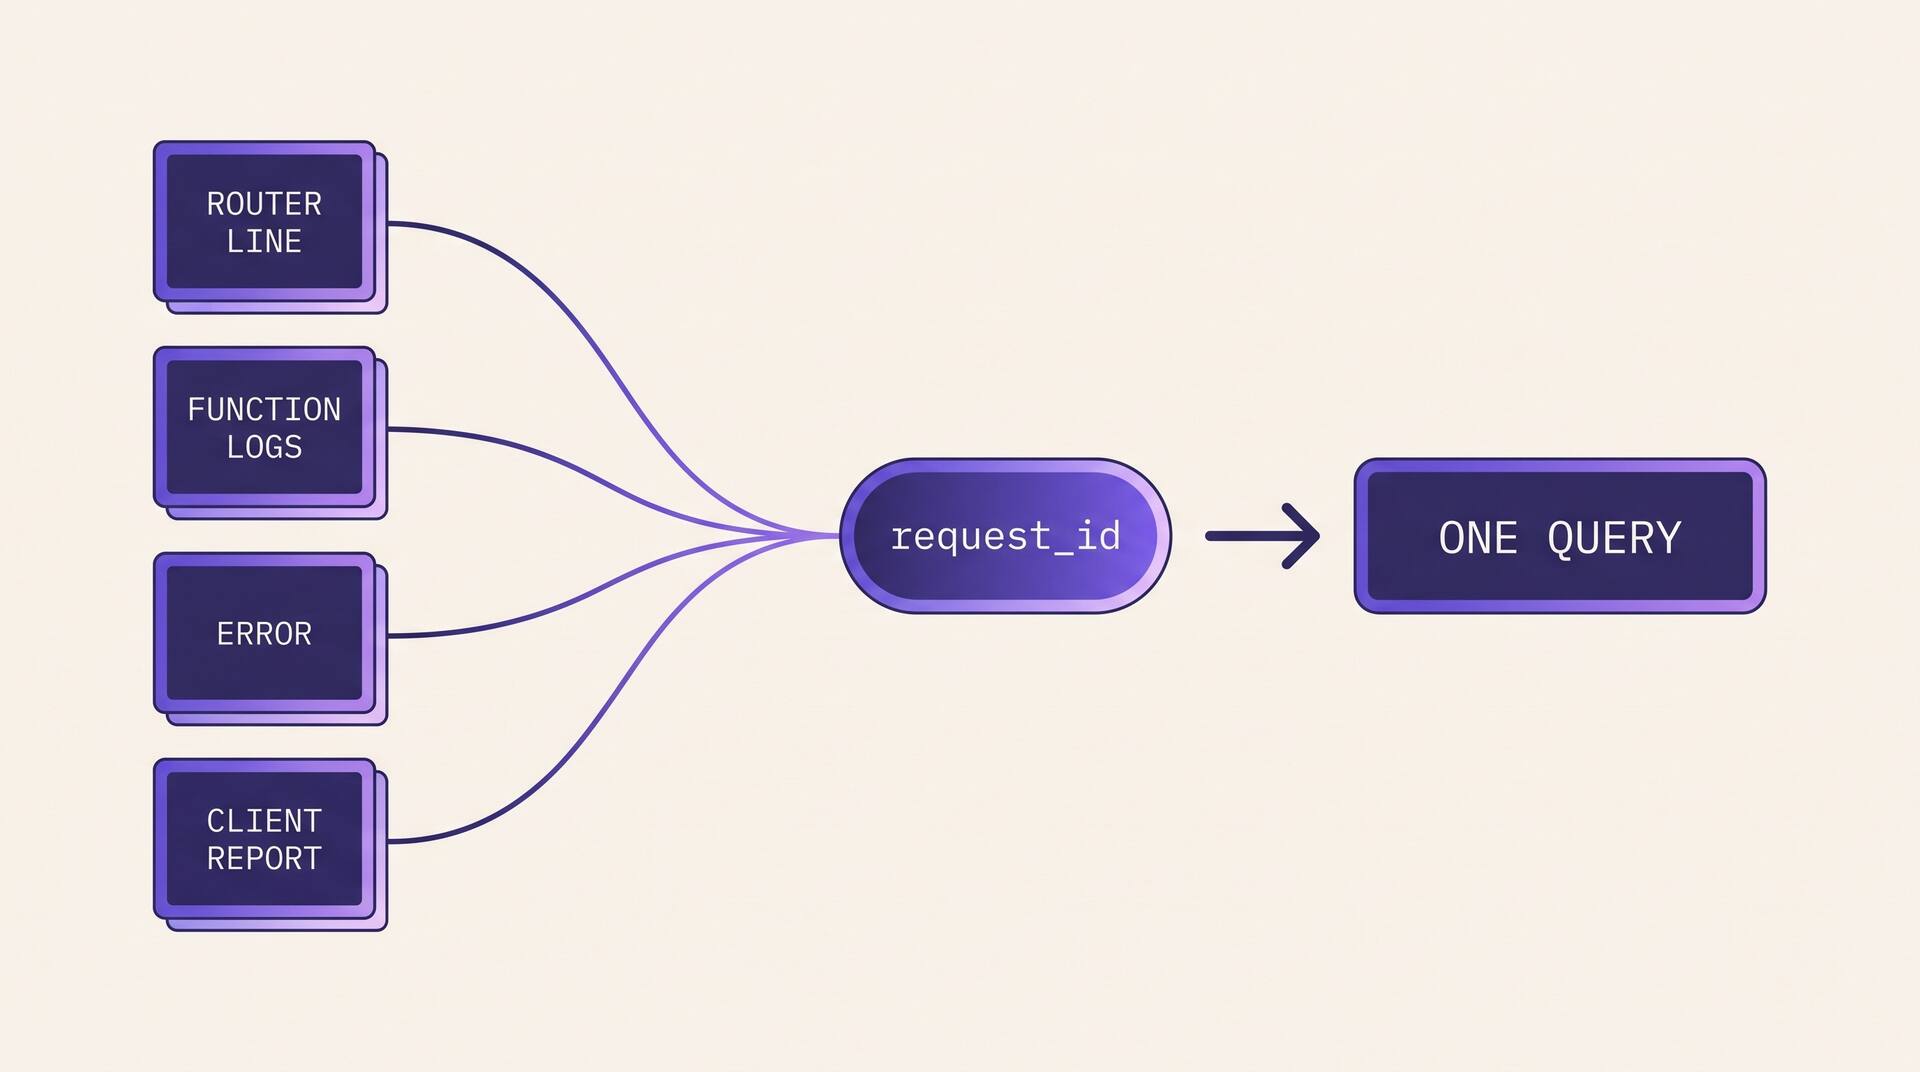
The payoff is a single query. Given one id, I get the router line, every log the function wrote, the error if there was one, and the timing, in order, for that one user's one chapter. No guessing from timestamps, no filtering by user id across four services.
Our client also reports failures itself. When a call comes back with a status we consider real, the browser posts the function name, the status and that same request id to an alerting endpoint. The support ticket and the log line meet each other.
I will be honest about the gap in this. We do not show the request id anywhere in the interface, so a user cannot read it off the screen and paste it to us. It exists in a response header that only a developer would go looking for. That is a five minute change I have not made, and every time I chase a report by timestamp I remember why I should.
What I would set up before writing the long job, not after
Four things, in the order I wish I had done them.
- 1
Decide what the log line says before you write the handler. If you cannot say in one sentence what a successful run of this thing looks like in the logs, you have not finished designing it.
- 2
Log the boundaries of every step with the same id, and make sure the last boundary is a real completion, not the moment the response object was constructed. Streams, background work and anything with retries all lie about this by default.
- 3
Alarm on the primary path, not the path you started with. We run an hourly job that scans database errors and edge function errors and pushes a grouped summary to Telegram, which is genuinely useful and which I like. It also reads the older Supabase side of our stack rather than the Fly side that now serves nearly every request. That is a known hole and I am writing it down here partly so I stop putting it off.
- 4
Choose your retention on purpose. Thirty days means the question "was this slower last month than it is now" has no answer for us. I accepted that trade to keep it simple, but it was a trade, not a default, and you should know which one you made.
The part that has nothing to do with tools
The reason logs go unread is not that they are hard to read. It is that on a small team nobody owns the act of looking when nothing is obviously wrong.
What worked for me was making the looking cheap enough to do out of curiosity. One script, one query, results in a terminal in two seconds. I check it after deploys and when a ticket smells structural, and the difference between that and a proper on call rotation is enormous, but the difference between that and nothing is bigger.
If you are building anything that runs longer than a person is willing to sit and watch, the logs are not an ops chore for later. They are the only record that the thing happened at all, and the version of them you get by default will confidently tell you that everything is fine.