

The thing is, most wrong numbers in a book were never made up by anyone. They’re there when you copy out some figures from a report, round them in a draft, or quote them from memory months after first reading them. Most can be caught with care prior to publishing.
In this guide, we have outlined six steps a nonfiction writer can take to verify the statistics for a manuscript prior to submission to an editor or a printer.
Step 1: List Every Number in Your Manuscript with Its Source
You can’t check anything until you know what to check. Read through the text, chapter by chapter, and underline all figures, including percentages, dates, prices, survey results, population statistics, etc.
Then write each of them in a simple list with four details:
- The figure as it is presented in your book
- The chapter and page it is found on
- The source from which you obtained it
- The page number or the link in that source
This is true whether you wrote all the chapters yourself by hand or used an AI book writer to write parts of the book. There is no doubt that AI can help you save a lot of drafting time, but any statistic in your draft must have a real source behind it before it can be published in a book.
If you find a figure with no source next to it, mark it clearly so you can come back to it in the last step.
Step 2: Go Back to the Original Source
Once your list is done, find the place where each figure first came from. It sounds simple enough, yet many writers read a number in a news article or blog post and never open the study it came from.
Numbers are subject to change as they are transferred. The report might say “about one in four adults,” then in the news it becomes “25 percent,” and a blogger makes it “20 percent.” By the time it gets to your notes, it might no longer be the same as what the researchers discovered!
Use the original report, study or official dataset wherever possible. If it’s online, save the URL and save the specific page or section. If it is a book or report from a library, write down the title, the edition number and also the page numbers, as these can be different in each edition.
Step 3: Turn Printed Tables into a Spreadsheet
Many original sources, especially printed reports and reference books, present their numbers in tables. Some of these tables run across dozens of rows, and copying them into your notes by hand takes a long time. It would be much worse if every number you retype is another chance to swap two digits, which is exactly the kind of mistake you’re trying to catch.
A quicker and safer option is to take a photo of the table and run it through a JPG to Excel converter. It reads the numbers in the image and places them into rows and columns that you can edit yourself in a spreadsheet. This tool uses OCR (optical character recognition), which is just the technology that reads printed text, numbers and signs from a picture.
For demonstration, we took a table from a government statistics report and ran it through TotBot’s free converter. Here is how the entire process works:
- Take a clear photo. Lay the page flat on a table, use good light and make sure the whole table is in the frame. A sharp, straight photo gives much better results than a blurry photo.
- Upload the image. The tool accepts most common formats like JPG, PNG and HEIC, so a photo directly from your phone works as well.
- Choose a mode. Standard mode copies the text and numbers into cells, which is enough for a simple table. High AI Accuracy also keeps merged cells, colors and bold text, which helps with tables that have grouped headings.
- Convert and download. You get an Excel file that you can open, sort, edit manually or use for calculations.
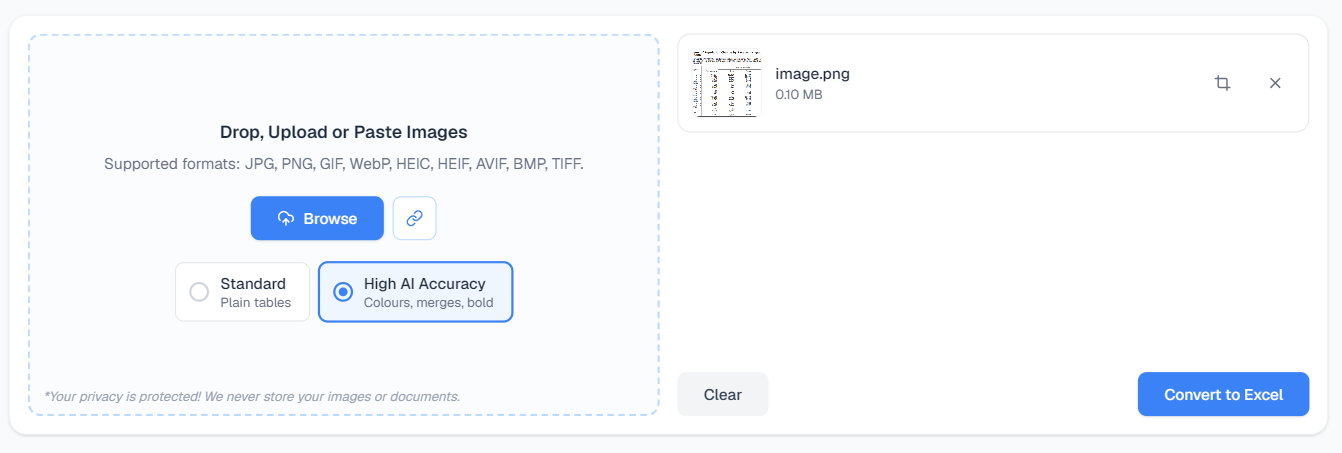
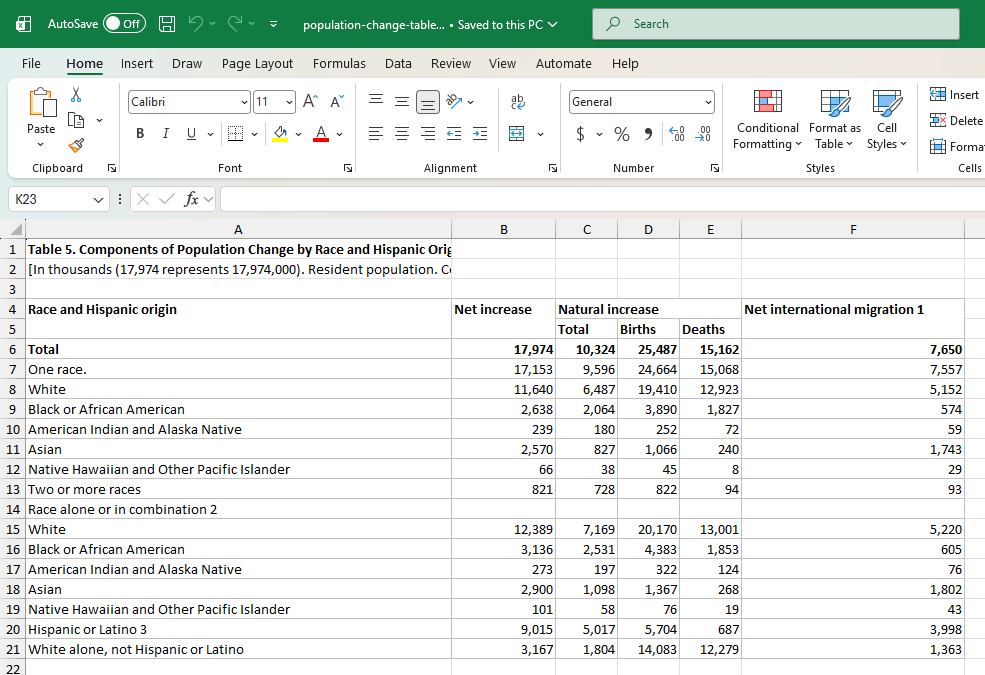
The tool also mentions that it does not store uploaded images of users, which is very important if you are working with material from any unpublished or private source.
One habit is very useful. Before you use the spreadsheet, compare it with the printed page row by row. A faded print or a fold in the page can still confuse any OCR tool. A quick side by side check makes sure that you are working from the correct figures.
Step 4: Recalculate and Cross Check Numbers
If the data is in a spreadsheet, you can verify it properly rather than just by looking at it on a page. These are just some of the aspects to take into consideration:
- Totals: If a table gives a total, add up the rows yourself and see if they match.
- Percentages: Recalculate any percentage you quote. If 120 out of 480 people said yes, that isn’t 30%. It’s 25 percent.
- Units and years: Ensure that kilograms did not become pounds somewhere along the way, and that a number from 2019 is not shown as current.
- Your own text: Check each number in your manuscript against the spreadsheet. Swapped digits are common, and 45 percent can easily become 54 percent in a draft.
If there is another reliable source containing that number, compare the sources. They may differ somewhat in the approaches to the subject but when there is a great difference, then the information should be further verified.
Update the list from step 1 each time you correct a figure. This way, you have a record of what you changed and why it got changed.
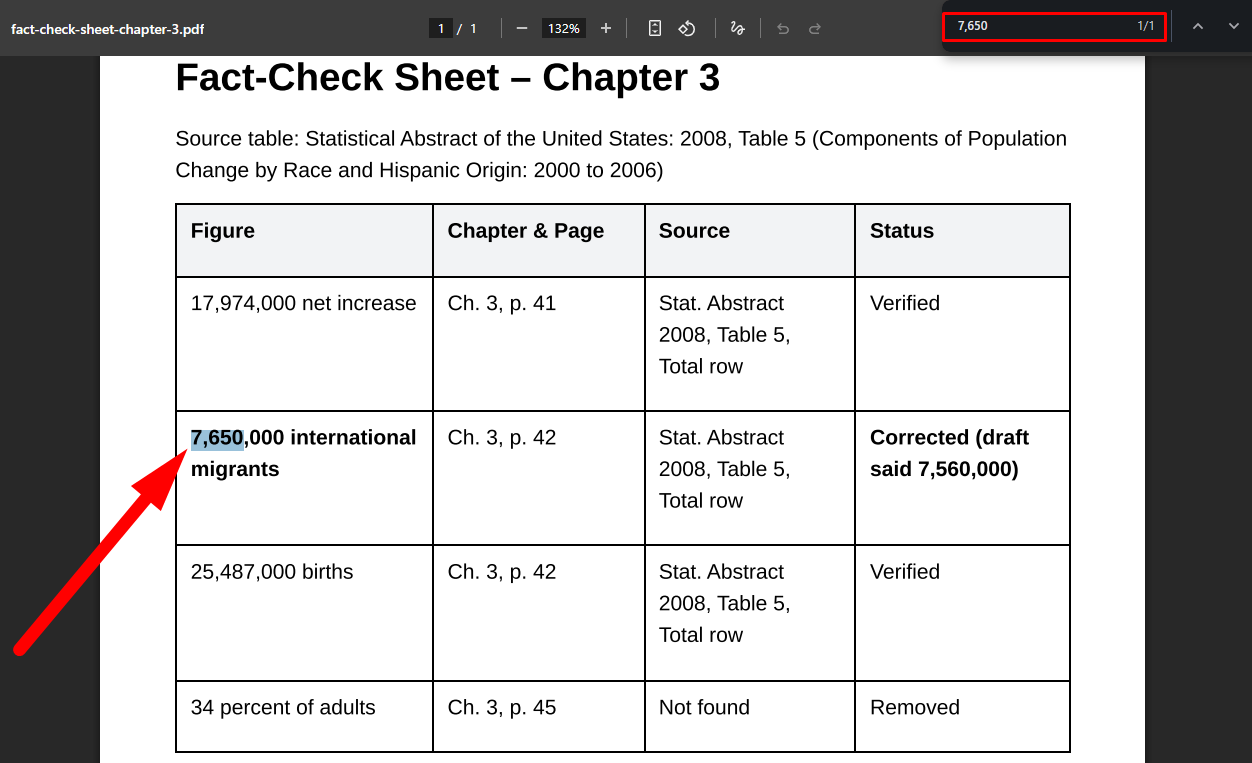
Step 5: Create a Fact Check Sheet to Share with Your Editor
By now, the list you started in step 1 has become a full record. It should have every figure, where it came from and whether it was confirmed. The next step is to turn it into a fact-check sheet that you send to your editor along with the manuscript.
A good fact-check sheet includes:
- The figure as it appears in the book
- The chapter and page
- The source, with its page number or link
- A status: verified, corrected or removed
It will be good to pass your list as a PDF file because a PDF file is the same everywhere; hence, your figures will not move when opened by the editor, and no one will be able to change the figure mistakenly while looking at it.
The best way to get a PDF file from a list of figures is by using TotBot’s text to PDF converter, in which you simply need to copy and paste the information that you have, or alternatively, you can upload the DOC, DOCX or TXT file that you have created. There is a built-in editor in the tool that lets you set a title for each chapter, make your corrected figures bold and present sources in the form of a table maintaining proper alignment.
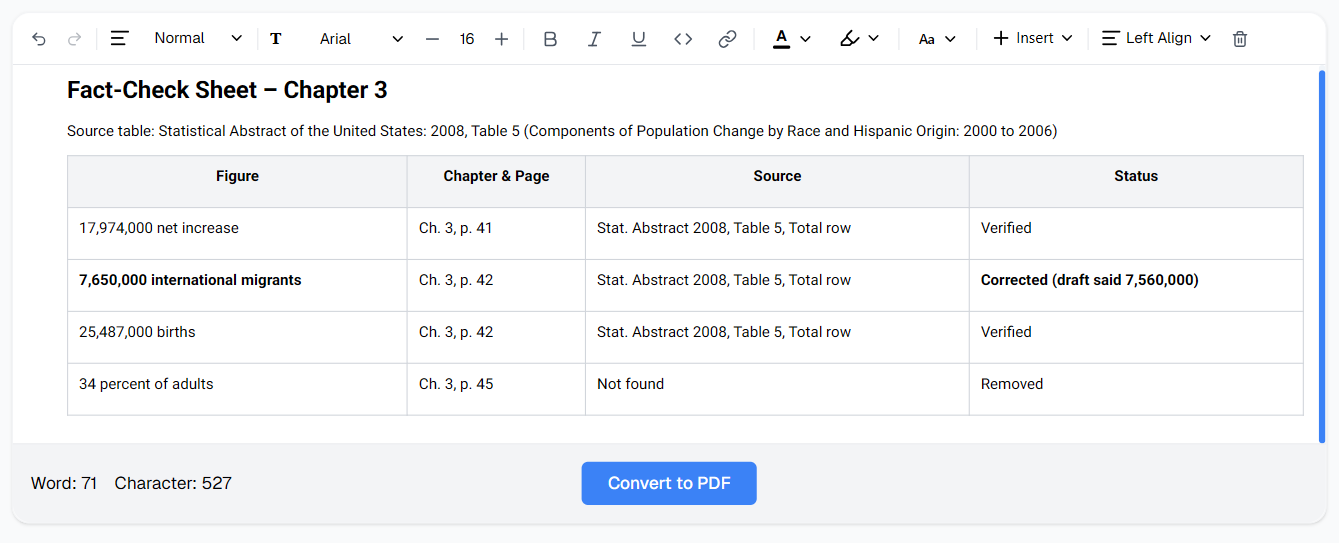
The process of downloading is fast and takes no more than a few seconds. All the information in the downloaded PDF document will be selectable and searchable. That means your editor can look up any figure and find out its place in the document by simply making a search query.
Step 6: What to Do When a Number Can’t Be Verified
Sometimes you will not be able to find where a number came from. The website you saved it from may have gone offline, or the figure only appears in other people’s articles with no study behind it. In that case, you have only three options left:
- Cut it. If your point still works without the number, this is the safest choice.
- Reword it. If the general point is well documented, make it without the exact figure. For example, write “a large share of adults” instead of “34 percent of adults.”
- Replace it. Look for a newer statistic on the same topic from a source you can check and verify.
What you should never do is keep the unverified stats and hope nobody notices. Some readers will look it up, especially in books about health, money or history.
Bottom Line
A single wrong stat is enough to make the reader doubt the accuracy of your nonfiction book. Fortunately, most of the errors are very easy to catch with a simple routine check. Just create a list of all figures along with their sources, verify from the primary source, create a spreadsheet out of the table rather than retyping the tables, recalculate the numbers, and finally send a fact-check sheet to the editor. Then choose what you are going to do with anything you can’t confirm.
It’s just additional effort at the end of your work but if you publish after doing all of this, you can be sure every number in your book is backed by a real source.
FAQs
What is a stat in a nonfiction book?
Any figure presented as a fact like percentages, survey results, prices, dates, measurements, rankings and population counts. If a reader can look it up and get a different answer, it must have a source.
When should I fact check my manuscript?
The best time is when the content is finalized but not yet sent to your editor or into your formatting. Checking too early will require re-doing the work when the rewrite is done. When checking after the layout has been completed, it is more difficult to make corrections.
Do self-published authors need a fact-check sheet?
Yes, and it is arguably more useful without a publisher, because there may be no one else checking your figures. Even without an editor, the sheet is a record you can go back to if a reader ever asks about a number.
Should I fact-check statistics in AI-generated drafts too?
Yes. You should always treat every figure in a draft written by AI as unverified until you find the original source yourself. AI tools can come up with numbers that sound right but don’t appear in any real study.